JOIN OUR EMAIL LIST
Sign up to receive email updates about UNICEF’s work for every child. Get a closer look at UNICEF programs in action, hear about emergency response efforts, and learn how you can help children. You can unsubscribe at any time.

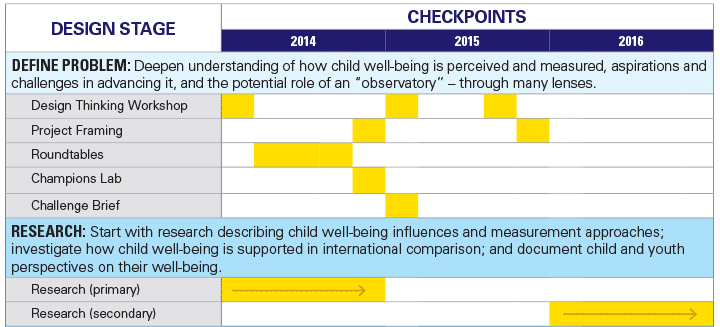
As a valued informant in our two-year journey to explore the potential for a children’s observatory in Canada, we’re pleased to share key developments and invite your continuing collaboration. A strategic plan is taking shape and we’ll have more to share soon.
UNICEF Report Card 13
UNICEF’s new Report Card, Fairness for Children, presents the UNICEF Index of Child Inequality to measure the depths of inequality in children’s well-being across rich countries. Canada is one of the more unequal societies for children and youth, ranking 26th of 35 nations. The Index of Child Inequality measures the distribution of outcomes in each indicator; the gap between the median and the bottom reveals the extent of inequality. UNICEF pioneered this approach to measuring inequality, and we believe every organization that monitors outcomes based on population averages can use this approach to measure inequality. By measuring the gaps we can reveal how far those left out of the benefits of our policies and services are trailing behind – and then include them.
The Index of Child Inequality, based on outcome gaps, explains Canada’s performance in the UNICEF Index of Child Well-being based on average outcomes (in UNICEF Report Card 11). This is because countries that have wider inequality in child well-being outcomes tend to have lower overall outcomes. They have fewer children doing as well as in better performing, more equal nations. This is an important new insight – not in the least because Canada’s persistent middle position in the Index of Child Well-being was the starting point for our journey to explore the potential for an observatory. Now we know our challenge is not just persistently mediocre child well-being, it is also persistently unequal child well-being. Now it is even clearer that to improve child well-being across the board, we have to narrow the inequality gaps.
Is children’s sense of well-being the canary in the inequality coalmine? The data in Report Card 13 call us to pay attention to children’s own sense of well-being, which has seen the greatest decline among the indicators we measured. While the rate of child poverty has remained stagnant, broader social and income inequality has increased and seems to explain this broad trend in children’s views about their own well-being. The crises in First Nations communities underline how children are bearing the greatest burdens of inequality.
Our companion analysis, Fairness for Children: Canada’s Challenge, dives into the root causes of inequality in Canada, and shows that we can close these gaps.
To read and share the full report, visit www.unicef.ca/irc13.
See parenting expert Alyson Schafer’s take on UNICEF Report Card 13.
“It’s the gap between the haves and have nots that erodes happiness. The greater the gap, the more the misery, and that gap is growing in Canada.”
Alyson Schafer, Huffington Post Blog, 16 May 2016
Who better to explain UNICEF Report Card 13 than children and youth? We collaborated with the Students Commission of Canada to discuss the report with a group of young people and hosted a roundtable for them to discuss their views with the Parliamentary Secretary to the Minister of Health, Kamal Khera. See what they said at our report launch on April 18.
“Adults need to allow youth to make their own choices and to choose their own path. Help them focus on their journey and not the destination.”
Youth roundtable participant
WorldVuze
UNICEF Canada is partnering with WorldVuze, an online site where K-12 students can safely share perspectives with other students on different issues. Our ‘Better than Before’ challenge invites young people to exchange their views on these questions:
The responses to this Challenge shed further light on how Canada’s children and youth define their own well-being. Responses reveal that young people have too little sleep, too little confidence in themselves and too much pressure to succeed. Some of these concerns are shared by children across cultures, family circumstances and economic conditions.

Cross-national research on child and youth well-being
An expert on child well-being in England who we interviewed expressed concern that, as a society, “we manage children like projects.” Last winter, UNICEF Canada initiated two research projects, in partnership with researchers from York University and the International Institute for Child Rights and Development, to examine young people’s well-being from a cross-national perspective. The researchers conducted interviews and surveys with 27 informants from 10 high-income countries at different positions on the UNICEF Index of Child Well-Being (Australia, Canada, England, Germany, The Netherlands, New Zealand, Norway, Sweden, the USA and Wales and) to identify the factors that may account for varying levels of child well-being. Youth focus groups were convened with 15 young people representing four countries (Canada, Germany, New Zealand and Norway) to reflect on the factors contributing to their sense of well-being. The final reports of these research projects will be released in fall 2016, and their findings will inform future efforts to measure and understand child well-being. We plan to continue focus groups with youth across Canada over the summer in collaboration with the Students Commission of Canada.
“My cat makes me happy.”
Youth informant, Canada
“It’s important for youth to flourish as youth from their own perspective. Not only about building successful adults but understanding better what it takes to flourish as children and youth. This is different than what adults think matters... Children demonstrated the importance of pets to their well-being, which no one had considered before.”
research informant, USA
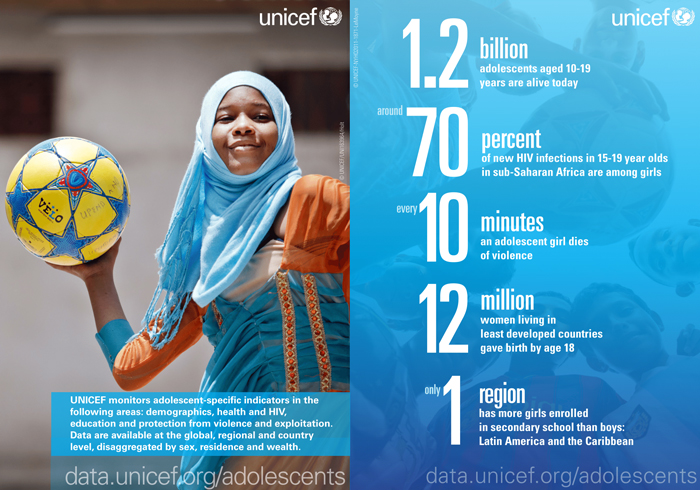
Adolescents in Numbers
In 2016, UNICEF launched a new collection of data about adolescents on our data platform at data.unicef.org/adolescents. It brings together a wealth of information from UNICEF’s Multiple Indicator Cluster Surveys (MICS) – the largest “census” in the world - on various dimensions of adolescent well-being including education, health and HIV, and protection from violence and exploitation. UNICEF supports governments in middle- and low-income countries to build their capacity to track and compare the situation of their children through MICS.
UN Data Innovation Lab
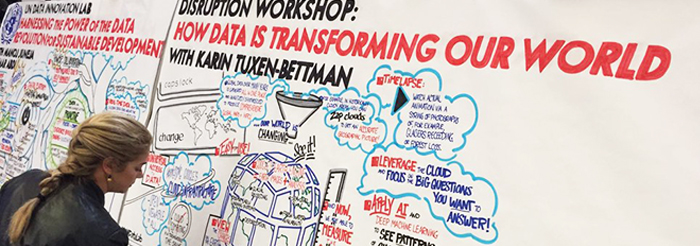
The data revolution is leading to an exponential increase in the volume and types of data available globally. The Data Innovation Lab enables UN agencies to join the data revolution by strengthening data exchange capabilities, skills and tools to use vast quantities of new data for evidence-based decision making. UNICEF and the World Food Program facilitated the first UN Data Innovation Lab workshop at technology think tank Singularity University in California.
The workshop series connects the UN family with private sector leaders, experts and entrepreneurs in the field of technology, data and innovation to explore how new data opportunities can be harnessed for sustainable development. New forms of data present both challenges and valuable opportunities for the work of UN agencies. Access to more detailed data can enable us to understand community needs, strengthen our programs, better inform policy decisions and remain institutionally agile to keep up with technological advances.
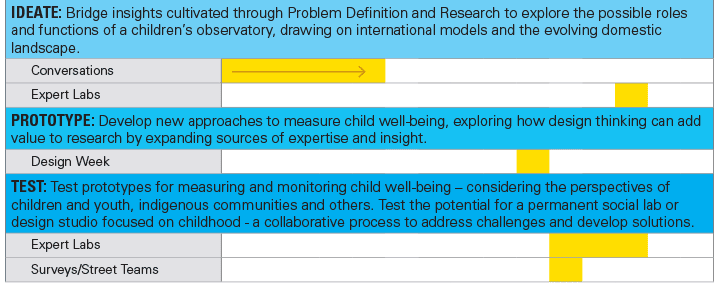
Prototype Testing
We’ve been feasibility testing prototypes that were ideated in our Design Week in October 2015 – Wellbot, YouthBooth and the Well-being Media Office. To date we’ve conducted 25 interviews with stakeholders and interest groups. Wellbot and YouthBooth will move to user testing - we’ll be working with youth to build and test advanced prototypes in 2016. If they pass user testing, we plan to build viable models engage children and youth in expressing their views on issues affecting them.
RBC Ideation Session
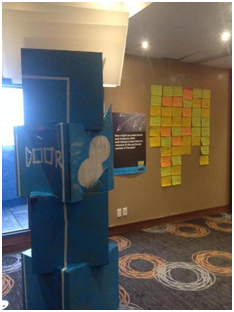
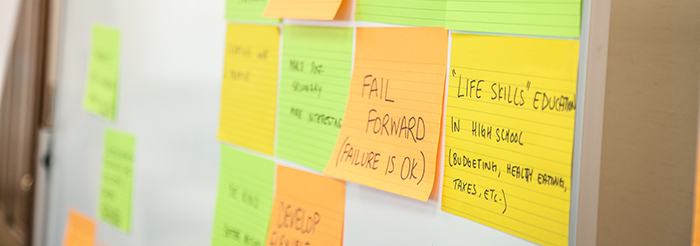
In April 2016, UNICEF Canada and Overlap Associates facilitated an ideation session for RBC. With more than 35 stakeholders and youth participants we explored the challenges youth are experiencing during the transition from adolescence to positive adult lives including further education, employment and entrepreneurship. Participants created a canvas of possible solutions to the challenges faced by transitioning youth:
Overall, it was an engaging opportunity for RBC, youth experts and youth representatives, alongside UNICEF experts, to tackle a new problem through a design thinking approach, resulting in collective insight and enthused participants and stakeholders.

Before a new show opens on Broadway, it runs in previews. Before previews, they fine-tune the show out of town. Before that, they rehearse and workshop. You’ve probably heard of a dress rehearsal—the first time they run the show for real with costumes and staging—but how about the “table read?” To start developing a play, they don’t rent a theatre. They borrow a table. They gather actors, hand out scripts and simply read the play aloud. They can test-drive the dialogue and the casting before the actors even bother standing up and making eye contact.
Here’s the single most important lesson that design thinking takes from the arts: trial and error. Writers produce multiple drafts. Actors, musicians and dancers rehearse. What could you accomplish if you didn’t have to get it all right the first time?
To iterate is to do something again and again, ideally getting better every time. Iteration is essential to design thinking, especially because it lowers the risk—and cost—of change. The folk wisdom on risk reduction is famous: don’t put all your eggs in one basket. Baskets are ideas. Eggs are resources. More baskets, more ways to win. Fewer eggs, less to lose. That means prototype your ideas and test them out, then learn from the testing and make more, better prototypes before committing to a course of action, a program, a policy and putting all your eggs into rolling out. Here’s how design thinkers iterate:
Pretend you’re a writer: how could you try out multiple drafts? Pretend you’re a dancer: how might you rehearse? Iteration is the “how-to” for adapting to change and responding to data and evidence. You’re not trying to get it all right the first time. You’re trying to learn enough from the first time to make it better the second time.
Linda Carson
Overlap Associates
“A design culture is nurturing. It doesn’t encourage failure, but the iterative nature of the design process recognizes that it’s rare to get things right the first time.”

 If you belong to or support a youth group, and there’s an interest in testing some of our prototypes and exploring other opportunities for children and youth to participate in Design Year, please let us know at policy@unicef.ca.
E-mail us at policy@unicef.ca with questions and suggestions – we would love to hear from you.
You are receiving this update because you participated in our activities. Please let us know if you don’t wish to receive future updates (policy@unicef.ca).